Search Questions
Search
Q: The mode of a set of data presented in the form of a frequency distribution table containing class intervals and their respective frequencies was 48.5. The lower limit of the modal class was 46.5 Frequency of modal class was 34. The frequency of the class interval immediately preceding the modal class was 32 and the frequency of the class interval immediately following the class was 25. What was the size of the modal class.
- A. 12
- B. 10
- C. 11
- D. 10.5
Correct Answer:
Option C -
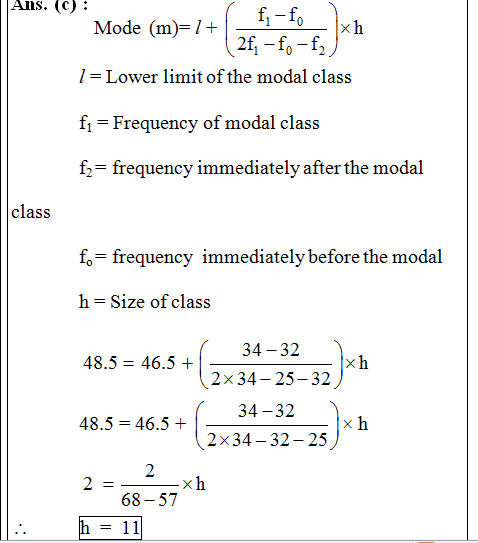
Explanations:
Address
12, Church Ln, The Adelphi, Allen Ganj, Prayagraj, Uttar Pradesh 211002
+91 9554973128
info.yctbooks@gmail.com
Download Our App

