Search Questions
Search

Q: .
- A. 1
- B. 2
- C. 3
- D. 4
Correct Answer:
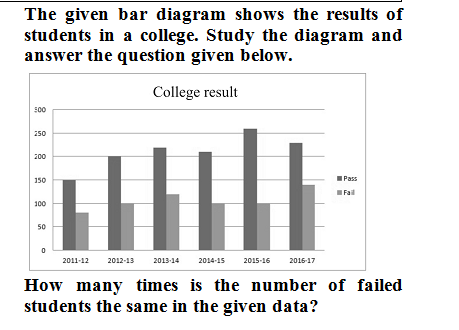
Option C - According to the given graph the number of failed student is same three times in 2012-13, 2014-15 and 2015 - 2016.
C. According to the given graph the number of failed student is same three times in 2012-13, 2014-15 and 2015 - 2016.
Explanations:
According to the given graph the number of failed student is same three times in 2012-13, 2014-15 and 2015 - 2016.Address
12, Church Ln, The Adelphi, Allen Ganj, Prayagraj, Uttar Pradesh 211002
+91 9554973128
info.yctbooks@gmail.com
Download Our App

